

Unlocking Content Success
Want to know if your content is truly working? This listicle reveals seven essential content performance metrics you need to track. Learn how to measure engagement rate, conversion rate, time on page, bounce rate, page views per session, social shares, and content ROI. Mastering these content performance metrics empowers you to refine your strategy, expand your reach, and ultimately achieve your business objectives. Let's get started.
1. Engagement Rate
Engagement rate is a crucial content performance metric that measures how actively your audience interacts with your content. It represents the percentage of people who engage with your content—through likes, shares, comments, clicks, saves, or other platform-specific actions—relative to your total reach or impressions. A high engagement rate signifies strong content resonance, audience connection, and ultimately, content effectiveness. This metric is fundamental for understanding whether your content is truly captivating your target audience and driving meaningful interactions.
Engagement rate is calculated as (total engagements / total reach or impressions) × 100. This seemingly simple formula provides a wealth of insight beyond mere view counts, enabling you to assess the quality and relevance of your content. For instance, a piece of content with a high view count but low engagement suggests that while many people saw it, few found it compelling enough to interact with.
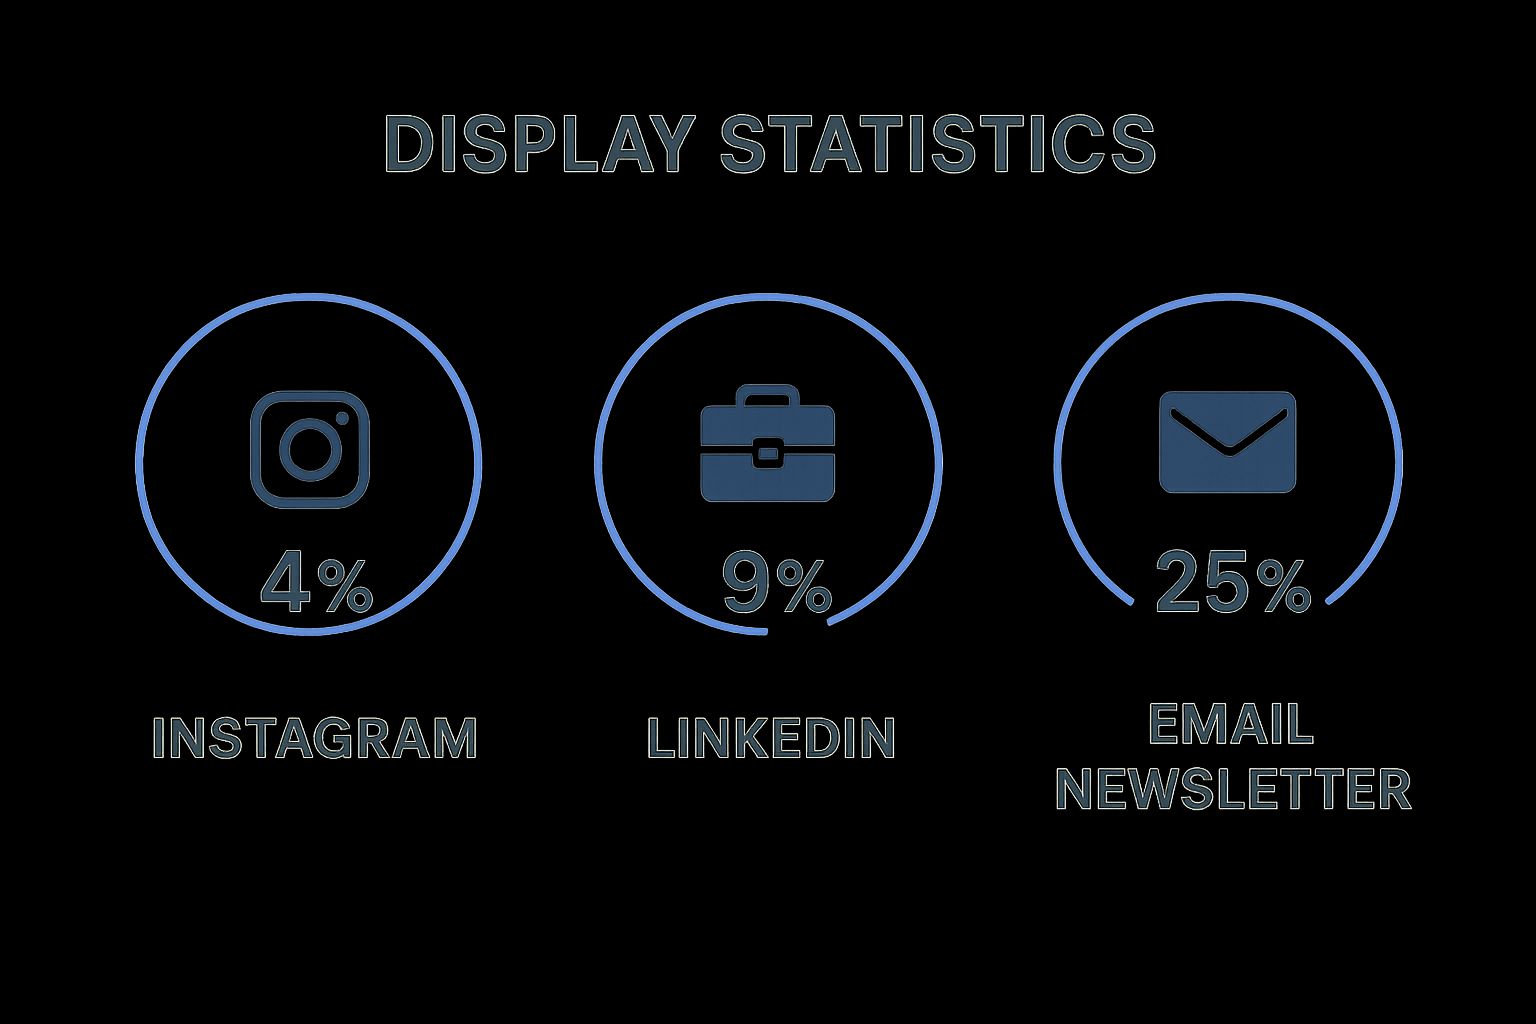
The infographic below visualizes key data related to engagement rate across different platforms.
As the infographic highlights, average engagement rates can vary drastically by platform, from around 1-2% on Instagram to potentially upwards of 25% for email newsletters. This emphasizes the need to benchmark your performance against both industry averages and your own historical data. The significantly higher potential engagement of email marketing underscores the power of targeted, personalized content delivered directly to subscribers’ inboxes.
Features of Engagement Rate:
- Calculated as (total engagements / total reach or impressions) × 100
- Varies by platform (social media vs. website vs. email)
- Can be broken down by engagement type (likes vs. comments vs. shares)
- Typically reported as a percentage
Pros:
- Provides deeper insight than simple view counts
- Indicates content quality and audience relevance
- Helps identify what content types drive interaction
- Can predict content virality potential
Cons:
- Varies widely across platforms, making standardization difficult
- Not all engagements are equal in value (e.g., a share is generally more valuable than a like)
- Can be artificially inflated through contentious or controversial topics
- Platform algorithm changes can affect metrics
Examples of Successful Implementation:
- Instagram: Beauty brand Glossier consistently achieves 3-5% engagement rates, exceeding the industry average of 1-2%.
- LinkedIn: Adobe's thought leadership content receives engagement rates of 8-10% through strategic audience targeting.
- Email: Patagonia's sustainability newsletters achieve 25%+ engagement rates through value-driven content.
Tips for Optimizing Engagement Rate:
- Benchmark against industry standards and your historical performance.
- Analyze which content types drive the highest engagement.
- Test different posting times, formats, and topics to optimize.
- Focus on quality engagement (comments/shares) over passive engagement (likes).
- Use engagement rate to inform content strategy adjustments. Learn more about Engagement Rate
Engagement rate deserves a top spot in the list of content performance metrics because it provides a direct measure of how effectively your content resonates with your audience. By understanding and optimizing your engagement rate, you can create more impactful content that fosters genuine connection, drives desired actions, and ultimately achieves your business objectives.
2. Conversion Rate
Conversion rate is a crucial content performance metric that measures the percentage of users who complete a desired action after interacting with your content. This action could be anything from making a purchase and signing up for a newsletter to downloading a resource or filling out a contact form. It's the bridge that connects your content's performance to tangible business outcomes, demonstrating the effectiveness of your content in driving desired user behavior. Instead of just measuring views or likes, conversion rate focuses on actions that contribute to your business goals.
Conversion rate is calculated as (number of conversions / total visitors or impressions) × 100. You can measure it for specific pages, entire marketing campaigns, or individual pieces of content. It's often segmented by traffic source (e.g., organic search, social media), device type (desktop, mobile), or user demographics to pinpoint what's working best and where improvements can be made. Tracking is typically implemented through UTM parameters, pixels, or website analytics platforms.
This metric deserves a place on this list because it directly links content efforts to business results. While other metrics like page views and social shares offer insights into engagement, conversion rate provides a clear picture of how content contributes to your bottom line.
Features and Benefits:
- Directly Tied to ROI: Shows how content contributes to revenue generation.
- Identifies Effective Content: Highlights which content pieces are best at driving desired actions.
- Optimization Focus: Allows for data-driven optimization towards specific goals.
- Beyond Engagement: Provides a metric that goes beyond vanity metrics like likes and shares.
- Segmented Analysis: Allows for granular analysis based on traffic source, device, and demographics.
Pros:
- Directly ties content to business results and ROI.
- Helps identify the most effective content for driving specific actions.
- Allows for optimization toward revenue generation.
- Provides a clear metric for content effectiveness beyond engagement.
Cons:
- Conversion paths can be complex and difficult to attribute fully.
- Requires proper tracking implementation.
- May overlook content's role in nurturing leads that don't immediately convert.
- Can focus teams too narrowly on short-term gains versus long-term brand building.
Examples of Successful Implementation:
- HubSpot increased blog-to-lead conversion rates by 250% through strategic calls-to-action (CTAs) and content upgrades.
- Shopify's educational content hub converts readers to free trials at 3-5% (the industry average is 1-2%).
- Dollar Shave Club's landing page videos converted visitors at 16% through compelling storytelling.
Actionable Tips:
- Set up goal tracking: Use Google Analytics or a similar platform to track conversions.
- Test different CTAs: Experiment with various CTA placements, wording, and design.
- Optimize for conversions: Focus on improving conversion rates, not just increasing traffic.
- Buyer's journey content: Create content tailored to different stages of the buyer's journey. Learn more about Conversion Rate
- Identify conversion barriers: Use heat mapping and user recording tools to understand user behavior and address any obstacles to conversion.
When and Why to Use Conversion Rate:
Use conversion rate when you want to measure the direct impact of your content on business objectives. It's essential for demonstrating the value of content marketing, optimizing campaigns, and making data-driven decisions. This approach is particularly valuable when you have specific goals in mind, such as lead generation, sales, or trial sign-ups.
Popularized By: CRO experts like Peep Laja of CXL Institute, marketing platforms like Optimizely and Unbounce, and digital marketing strategists like Avinash Kaushik.
3. Time on Page/Dwell Time
Time on Page/Dwell Time is a crucial content performance metric that measures how long users spend actively engaged with a specific piece of content before navigating away. This metric provides valuable insight into content quality, relevance, and user interest, going beyond mere pageviews to reveal how deeply your audience is connecting with your material. Longer time spent on a page typically suggests more thorough consumption and a higher level of engagement, indicating that your content is resonating with your target audience. This deserves its place on the list of essential content performance metrics because it offers a nuanced understanding of user behavior and content effectiveness.
How it Works:
Time on Page is calculated by measuring the time difference between a user arriving on a page and then clicking to another page on your website. It's essentially the duration between pageview timestamps. Dwell time, a closely related metric, often refers specifically to the time spent on a page before returning to the search engine results page (SERP). Both metrics offer insights into user engagement and satisfaction. Features of Time on Page/Dwell Time measurement include:
- Measurement: Expressed in minutes and seconds.
- Calculation: Based on the difference between pageview timestamps.
- Variability: Time on page varies greatly depending on content format. A video might have a longer average time on page than a short infographic.
- Related Metrics: Google Analytics tracks 'Average Session Duration' which provides a broader view of user engagement across your entire website.
Pros:
- Indicates Content Depth and Quality: Unlike metrics like pageviews, time on page reveals how thoroughly users are consuming your content, reflecting its depth and quality.
- Identifies Engaging Topics and Formats: By analyzing time on page for different content pieces, you can identify which topics and formats resonate most with your audience.
- Correlation with SEO: Search engines like Google consider dwell time as a potential ranking factor. Higher dwell times can signal to search engines that your content is relevant and valuable to users.
- Insight into User Attention: Time on page provides a window into user attention and interest levels, helping you understand what captures their attention and what loses it.
Cons:
- Inactive Tabs: Can be skewed by users who open a tab and leave it open without actively engaging with the content.
- Not Always Positive: Long dwell times aren't always indicative of positive engagement. Confusion or difficulty finding information can also lead to longer times.
- Measurement Variations: Measurement methodologies can vary across different analytics platforms, making direct comparisons difficult.
- Context is Key: "Ideal" time on page varies drastically depending on content type and purpose. A short blog post will naturally have a lower average time on page than a long-form guide.
Examples of Successful Implementation:
- The New York Times: Long-form interactive pieces on The New York Times website often see average time on page exceeding 6 minutes, compared to around 2 minutes for standard news articles.
- Wait But Why: Known for its in-depth explorations of complex topics, Wait But Why achieves remarkably high average dwell times of 12+ minutes, demonstrating the power of comprehensive, engaging content.
- REI: REI’s expert-driven guide content keeps users engaged for an average of 4+ minutes, thanks to valuable information presented in a clear and user-friendly format.
Actionable Tips:
- Benchmark Against Content Type: Compare time on page against expected benchmarks for your specific content length and format. For instance, aim for 3+ minutes for long-form articles.
- Use Scroll Depth Tracking: Supplement time on page with scroll depth tracking to understand how far users are scrolling through your content, providing additional context.
- Visual Elements: Break up large blocks of text with images, videos, and other visual elements to encourage complete consumption.
- Interactive Elements: Incorporate interactive elements like quizzes, polls, and calculators to boost engagement and increase time on page.
- Set Realistic Benchmarks: Establish benchmarks based on your content type and audience. Learn more about Time on Page/Dwell Time
When and Why to Use Time on Page/Dwell Time:
Use this metric when you want to understand how users are interacting with your content beyond simple pageviews. It's particularly useful for:
- Content Optimization: Identify high-performing content and areas for improvement.
- User Experience Enhancement: Understand how users navigate and engage with your site.
- SEO Strategy: Improve search rankings by creating content that keeps users engaged.
- Content Strategy Development: Inform future content creation by focusing on topics and formats that resonate with your audience.
Time on Page/Dwell Time provides invaluable insights into the effectiveness of your content marketing efforts. By understanding and utilizing this metric, you can create more engaging, valuable content that resonates with your target audience, improves your SEO performance, and ultimately drives business success. This metric is crucial for anyone involved in content creation, from small business owners and bloggers to digital marketing professionals and web agencies.
4. Bounce Rate
Bounce rate is a crucial content performance metric that reveals how well your content captures visitor interest and encourages them to explore your website further. It measures the percentage of visitors who land on a page and then leave without interacting with the site or navigating to another page. Essentially, it indicates whether your content resonates with users enough to prompt further exploration or desired actions like clicking a link, submitting a form, or making a purchase. Understanding and optimizing your bounce rate is fundamental to improving content engagement and achieving your website's goals.
How Bounce Rate Works:
Bounce rate is calculated with a simple formula: (single-page sessions / total sessions) × 100. A single-page session is recorded when a user enters and exits your website from the same page without triggering any other requests to the analytics server. The resulting percentage represents your bounce rate. For example, if 100 users visit your site and 60 of them leave after viewing only one page, your bounce rate is 60%. While a "good" bounce rate varies widely (typically between 40-70%) depending on industry and content type, a lower bounce rate generally suggests more engaging content.
Why Bounce Rate Matters:
Bounce rate deserves its place on this list because it directly reflects the effectiveness of your content in capturing and retaining user attention. A high bounce rate can signal several underlying issues:
- Irrelevant Content: Users might be bouncing because the content doesn't align with their expectations based on the search query or referring link.
- Poor Content Quality: Low-quality, confusing, or poorly written content can quickly drive visitors away.
- Technical Issues: Slow loading times, broken links, or a poor mobile experience can frustrate users and lead to higher bounce rates.
- Misleading Titles and Meta Descriptions: If your titles and meta descriptions over-promise and under-deliver, users may feel misled and leave immediately.
Features and Benefits of Monitoring Bounce Rate:
- Identify Weak Content: Bounce rate helps pinpoint underperforming content that fails to engage users or meet their expectations.
- Assess Content Relevance and Quality: High bounce rates can indicate potential issues with content relevance or quality.
- Compare Content Performance: Allows comparison between different content types, topics, and formats to identify what resonates best with your audience.
- Reveal UX Problems: Bounce rate can unveil navigation or UX issues that hinder content consumption.
- Measurable at Different Levels: Can be analyzed site-wide, by section, or at the individual page level for granular insights.
Pros and Cons:
Pros:
- Easy to track and understand.
- Provides valuable insights into user engagement.
- Helps prioritize content optimization efforts.
Cons:
- Can be misleading for single-page sites or self-contained content (e.g., landing pages).
- Requires context from other metrics like time on page for accurate interpretation.
- Doesn't distinguish between negative bounces (users leaving due to dissatisfaction) and fulfilled user intent (e.g., finding a quick answer).
Examples of Successful Implementation:
- Backlinko reduced bounce rates from 69% to 34% by restructuring content with clear hierarchy and visual elements, improving readability and engagement.
- Moz's learning center maintains bounce rates below 25% through strategic internal linking and related content suggestions, encouraging further exploration.
- Mayo Clinic achieves 30-40% bounce rates on its health information pages by providing comprehensive, authoritative content that thoroughly answers user questions.
Actionable Tips for Lowering Bounce Rate:
- Related Content Recommendations: Suggest related articles or resources to encourage further browsing.
- Accurate Titles and Meta Descriptions: Ensure your content matches user expectations set by titles and meta descriptions.
- Strategic Internal Linking: Guide users to relevant content within your site.
- Optimize Page Load Speed: Reduce abandonment by ensuring fast loading times.
- Segment Bounce Rate by Traffic Source: Identify the quality of traffic from different channels and tailor content accordingly.
Popularized By:
Bounce rate as a metric was popularized by Google Analytics. Digital marketing analysts like Avinash Kaushik have significantly contributed to understanding its proper use and interpretation, while UX experts like Jakob Nielsen connect bounce rate to overall website usability. By understanding and utilizing bounce rate effectively, you can significantly improve content performance and achieve your website's objectives.
5. Page Views per Session
Page Views per Session is a crucial content performance metric that measures the average number of pages a user visits during a single session on your website. It provides valuable insights into how effectively your content encourages users to explore further and engage more deeply with your site. This metric deserves its place on the list because it goes beyond simple traffic numbers and delves into the effectiveness of your content in driving continued engagement and potentially, conversions. Understanding and optimizing Page Views per Session can significantly impact your overall content strategy.
How it Works:
Page Views per Session is calculated by dividing the total number of page views by the total number of sessions within a specific timeframe. For content-rich websites, a typical range falls between 1.5 and 3 pages per session. However, this can vary widely based on industry, website type, and content strategy.
Why Use It?
This metric helps you understand how well your content captures user interest and guides them through your website. A higher Page Views per Session generally suggests that your content is compelling, your internal linking strategy is effective, and your site navigation is intuitive. This translates to higher user engagement, increased brand awareness, and potentially, improved conversion rates.
Features and Benefits:
- Calculated by dividing total page views by total sessions: A straightforward calculation readily available in analytics platforms.
- Typically ranges from 1.5-3 pages per session for content sites: Provides a benchmark for comparison within your industry.
- Directly related to, but distinct from, bounce rate: While bounce rate measures single-page sessions, Page Views per Session provides a broader view of engagement beyond the initial landing page.
- Can be segmented by traffic source, content type, or user demographics: Allows for granular analysis to identify specific areas for improvement.
- Indicates content's ability to drive deeper site engagement: Helps assess the effectiveness of your content in encouraging exploration.
- Helps evaluate internal linking strategies and content relationships: Reveals how well your content guides users to related information.
- Identifies successful content journeys and user paths: Provides insights into how users navigate your site and discover content.
- Correlates with higher conversion potential and brand engagement: Engaged users are more likely to convert and become loyal customers.
Pros:
- Strong indicator of content's ability to drive deeper site engagement.
- Useful for evaluating internal linking strategies and content relationships.
- Helps identify successful content journeys and user paths.
- Often correlates with higher conversion potential and increased brand engagement.
Cons:
- Higher isn't always better: Excessively high numbers could indicate poor UX, forcing users to click through multiple pages to find the information they need.
- Doesn't account for content quality or depth of engagement: A user might click through multiple pages without actually consuming the content meaningfully.
- Can be inflated by pagination: Splitting content across multiple pages artificially increases page views without necessarily reflecting genuine user engagement.
- May miss single-page deep engagement: Some users might find all the information they need on a single page, resulting in a low Page Views per Session despite a positive user experience.
Examples of Successful Implementation:
- The Atlantic achieves 3.4 pages per session through strategic related content modules at the conclusion of articles.
- Investopedia drives 4+ pages per session through comprehensive internal linking within their financial content.
- WebMD maintains 5+ pages per session through connected health information pathways.
Actionable Tips:
- Create content clusters around related topics: Group related articles together to encourage further exploration.
- Implement "you might also like" recommendation widgets: Suggest related content based on user behavior and interests.
- Use contextual internal linking within content body: Link to relevant pages within your articles to guide users to more information.
- Develop content series that naturally lead readers from one piece to the next: Create a narrative flow that encourages continued engagement.
- Analyze top user paths to identify successful content journeys: Understand how users navigate your site and optimize content accordingly.
Popularized By:
Content strategists, media companies, and analytics platforms like Google Analytics and Adobe Analytics have all contributed to the popularity and understanding of Page Views per Session as a key content performance metric.
6. Social Shares and Amplification
Social shares and amplification metrics are crucial content performance metrics that track how often your content is shared across social media platforms and other distribution channels. This metric reveals your content's ability to spread organically through your audience's networks, providing valuable insights into its quality, relevance, and emotional impact. Essentially, it measures how compelling your content is, motivating audiences to share it with their connections. Understanding these metrics can significantly impact your content strategy and overall marketing efforts.

This metric deserves a spot on any content performance checklist because it directly reflects audience engagement and the potential for viral reach. It moves beyond simple views and clicks, indicating active participation and endorsement from your audience. Features of this metric include:
- Quantifiable Sharing Data: Includes shares, retweets, reposts across various platforms like Twitter, LinkedIn, Facebook, etc.
- Measurable in Multiple Ways: Can be measured as absolute numbers (e.g., total shares) or as a share rate (shares per view), providing different perspectives on performance.
- Platform-Specific Breakdown: Often segmented by platform, allowing you to identify which channels resonate most with your content and tailor your strategy accordingly.
- Private Sharing (When Possible): May include private shares via email or messaging apps when tracking is feasible, offering a glimpse into "dark social" activity.
Benefits of Tracking Social Shares and Amplification:
- Viral Potential: High share counts signal potential for virality and widespread organic reach.
- Extended Reach: Amplification pushes your content beyond your immediate followers, tapping into new audiences through social networks.
- Social Proof: Sharing acts as social proof, enhancing credibility and building trust among potential customers.
- Increased Influence: Content with high share rates often correlates with increased brand influence and authority.
Challenges of Relying Solely on Social Shares:
- Platform Variability: Sharing patterns vary dramatically across platforms and demographics, making direct comparisons difficult.
- Emphasis on Emotionality: Metrics can sometimes favor controversial or emotionally charged content over more substantive material, potentially skewing your content strategy.
- Declining Share Counts: Overall share counts are decreasing on many platforms as users become more discerning about what they share.
- Tracking Difficulties: Comprehensive tracking across all channels, especially private sharing, can be challenging.
Examples of Successful Implementation:
- BuzzFeed: Their data-driven approach identifies content with specific “share triggers,” routinely achieving share rates of 2-5%.
- The New York Times: Innovative formats, like their "Snow Fall" interactive feature, have generated over 10,000 shares per hour at peak times.
- TED Talks: Consistently produce thought-provoking, concise video content that averages 1,000+ shares per day.
Actionable Tips for Improving Social Shares:
- Incorporate Share-Worthy Elements: Include surprising data, emotional stories, and practical utility to make your content more appealing.
- Optimize Sharing Functionality: Implement visible, platform-specific share buttons to make sharing effortless.
- Tailor Content to Platforms: Create platform-specific versions of your content for optimal sharing and engagement.
- Analyze Sharing Patterns: Regularly analyze your most-shared content to identify recurring patterns and audience preferences.
- Prioritize Shareability: Consider shareability during content creation, not just as an afterthought.
Key Influencers and Resources:
- BuzzSumo: A popular platform for measuring content sharing metrics.
- Jonah Berger: Author and researcher known for his work on viral content characteristics.
- Social Media Strategists: Thought leaders like Jay Baer and Mark Schaefer offer valuable insights into social media strategy.
By understanding and actively monitoring social shares and amplification, you can refine your content strategy, expand your reach, and build a stronger online presence. This metric provides essential feedback on audience engagement and helps you create content that truly resonates with your target market.
7. Content ROI/Revenue Attribution
Content ROI/Revenue Attribution, a crucial content performance metric, measures the financial return generated from your content marketing efforts relative to the investment. In simpler terms, it tells you how much money you're making (or losing) on your content. This is a critical metric for demonstrating the value of content marketing and justifying continued investment. Its inclusion in any list of essential content performance metrics is undeniable because it directly links content efforts to bottom-line business results.
This metric goes beyond vanity metrics like pageviews and social shares, focusing on the tangible impact content has on revenue generation. How does it work? It calculates the profit generated by content by subtracting content costs from the revenue attributed to it, then dividing that number by the content costs and multiplying by 100 to express it as a percentage. This allows you to see exactly how much return you’re getting for every dollar spent.
Calculating Content ROI involves several key features:
- Formula: (Revenue attributed to content - Content costs) / Content costs × 100
- Attribution Modeling: This is essential for connecting specific content pieces to conversions. It helps determine which content touchpoints influenced a customer's journey towards a purchase.
- Measurement Levels: You can measure Content ROI at various levels, including individual content pieces, campaigns, or entire content types (e.g., blog posts, videos).
- Lifetime Value (LTV): Incorporating LTV calculations provides a more accurate long-term view of content performance, especially for content designed to nurture leads over time.
Pros:
- Demonstrates Business Impact: Clearly shows how content contributes to profitability.
- Justifies Investment: Provides concrete data to support content marketing budget requests.
- Optimizes Resource Allocation: Helps identify high-performing content types and allocate resources effectively.
- Data-Driven Optimization: Enables data-backed decisions based on financial outcomes, not just engagement metrics.
Cons:
- Attribution Challenges: Accurately attributing revenue to specific content pieces can be complex.
- Intangible Value: Doesn’t fully capture the value of brand building and relationship development fostered by content.
- Sophisticated Tracking: Requires robust tracking and analytics implementation.
- Undervaluing Long-Term Impact: May undervalue top-of-funnel content that contributes to long-term customer relationships.
Examples of Successful Implementation:
- Kraft's content marketing hub generates 4x better ROI than traditional advertising by delivering targeted content to specific audience segments.
- American Express OPEN Forum attributes over $500 million in revenue to its small business content strategy, demonstrating the power of thought leadership and community building.
- Salesforce measures 350%+ ROI on educational content through pipeline influence modeling, showing how content can directly impact sales pipeline growth.
Actionable Tips for Measuring Content ROI:
- Implement Multi-Touch Attribution Modeling: This helps to understand the influence of various content pieces across the customer journey.
- Track Micro-Conversions: Monitor smaller actions, like email sign-ups or content downloads, as leading indicators of potential ROI.
- Calculate Both Short-Term and Long-Term ROI: Assess immediate impact as well as long-term value generated by content.
- Include All Costs: Factor in creation, distribution, technology, and staff time when calculating total content costs.
- Use Content Scoring: Connect content engagement with sales outcomes to quantify the impact of specific content pieces on lead nurturing and sales.
When and Why to Use This Approach:
Content ROI measurement is especially important for businesses focused on lead generation, sales, and direct revenue from content. It’s useful for demonstrating the value of content marketing to stakeholders, optimizing content strategy, and making informed decisions about resource allocation. While challenging to implement perfectly, even imperfect Content ROI data can offer valuable insights.
For those looking to monetize specific content channels, like email newsletters, understanding the nuances of ROI becomes crucial. Learn more about Content ROI/Revenue Attribution and explore strategies for effectively monetizing your content efforts. This metric is crucial for any business, from small startups to large enterprises, seeking to maximize the impact of their content marketing investment. Influential figures and organizations in the marketing ROI space, like Jim Lenskold and the Content Marketing Institute, have further popularized and developed frameworks for measuring and optimizing Content ROI. Enterprise content platforms like Contently and NewsCred, as well as marketing attribution companies like Bizible and Neustar, also offer tools and resources to help businesses track and analyze their content performance in terms of ROI.
7 Key Content Performance Metrics Comparison
| Metric | 🔄 Implementation Complexity | 💡 Resource Requirements | ⭐ Expected Outcomes | 📊 Ideal Use Cases | ⚡ Key Advantages |
|---|---|---|---|---|---|
| Engagement Rate | Moderate: requires tracking interactions | Medium: analytics tools, platform data | Measures audience interaction quality | Social media, email campaigns | Indicates content resonance & predicts virality |
| Conversion Rate | High: needs goal tracking & attribution | High: tracking pixels, UTM parameters | Direct link to business goals & ROI | Lead generation, e-commerce, campaigns | Connects content to revenue & optimizes actions |
| Time on Page/Dwell Time | Low to moderate: timestamp analysis | Low: standard web analytics tools | Reflects content relevance & user interest | Content quality evaluation, SEO | Measures depth of engagement & aids SEO ranking |
| Bounce Rate | Low: simple ratio calculation | Low: standard analytics setup | Identifies content or UX issues | Website UX, content relevance checks | Highlights poor engagement & navigation issues |
| Page Views per Session | Low to moderate: session/page view tracking | Low to medium: analytics platforms | Measures site engagement & user journeys | Content sites, media, internal linking | Shows content’s ability to drive exploration |
| Social Shares & Amplification | Moderate: social platform tracking tools | Medium: social listening and sharing tools | Indicates viral potential & word-of-mouth | Social campaigns, brand awareness | Extends reach & provides social proof |
| Content ROI/Revenue Attribution | High: complex attribution modeling | High: multi-touch analytics & cost tracking | Measures financial return on content | Executive reporting, budget justification | Directly links content to profit & marketing impact |
Putting Metrics to Work
Mastering content performance metrics is more than just collecting numbers; it's about understanding the story those numbers tell. From engagement rate and conversion rate to time on page and bounce rate, each metric offers a unique perspective on how your audience interacts with your content. By analyzing metrics like page views per session, social shares, and ultimately, content ROI, you gain valuable insights into what resonates, what falls flat, and where opportunities lie. These key takeaways empower you to refine your content strategy, ensuring every piece you create contributes to your overall goals.
To truly optimize your content, leverage the power of data analysis. By understanding these metrics and how they interact, you can make informed decisions about your content strategy. For a deeper dive into this approach, explore the insights provided by resolution Reichert Network Solutions GmbH on data-driven decision making. This knowledge allows you to move beyond guesswork and embrace a more strategic, targeted approach to content creation.
Mastering these concepts translates directly to tangible benefits: increased audience engagement, higher conversion rates, and a stronger ROI. It’s about creating content that not only connects with your audience but also drives meaningful results for your business. Don't just create content – create content that performs. Ready to unlock the power of your content data? BlogMaker offers a built-in analytics suite to easily track these crucial content performance metrics, giving you the insights you need to optimize and succeed. Start your free trial today and see the difference data-driven content can make.